
Figure 1. Visual Fields Easy app screening test (left panel) of the central 30º radius and the Humphrey Field Analyzer 24-2 SITA Standard grayscale printout (right panel) for the right eye of a patient with advanced glaucomatous visual field loss (A). Visual Fields Easy app screening test (left panel) of the central 30º radius and the Humphrey Field Analyzer 24-2 SITA Standard grayscale printout (right panel) for the right eye of a patient with moderate glaucomatous visual field loss (B).
Approximately 40 years ago, perimetry and visual field testing advanced from manual kinetic testing using a Goldmann perimeter or a tangent screen to automated procedures controlled by a microprocessor. Clinicians now have accurate and efficient automated methods that use Bayesian test strategies such as the Swedish Interactive Threshold Algorithm (SITA)1 and the Zippy Estimation of Sequential Thresholds2 to acquire visual field sensitivity values, age- and location-adjusted normative databases, multivariate statistical and mathematical analysis procedures, monitoring of alignment, testing of different visual functions, and many other useful features. Technological advances suggest future developments, and this article discusses several that could become useful clinical diagnostic tools.
VISUAL FIELD TESTING PATTERNS
Nearly all visual field testing for glaucoma patients is performed for 50 to 80 locations in the central 24º or 30º radius. Although this represents a region where glaucomatous visual field deficits most frequently occur, it is also possible that the far periphery beyond the 30º radius and the macular region may harbor glaucomatous functional losses. It has been more than 30 years since the far periphery has been evaluated in glaucoma patients, and technology has advanced considerably since that time. Current methods of testing the far periphery are very time consuming, indicating the need for efficient procedures.
Scanning laser ophthalmoscopy, optical coherence tomography (OCT), and other imaging modalities have revealed that structural damage occurs in the macula. Some investigations have reported functional visual field abnormalities in the macula of glaucoma patients,3-5 but it is not clear what testing method would be most appropriate for this region. With methods of evaluating the entire visual field efficiently, it may be possible to improve clinicians' understanding of structure-function relationships and the underlying basis of glaucomatous damage.
VISUAL FIELD SCREENING
Recent advances in smartphone and tablet technology provide high spatial and temporal resolution, a large dynamic intensity range, accurate calibration, and a lightweight inexpensive device that does not require a continuous external power source, thereby enabling their use as a visual field screening tool. Figure 1 presents two examples of glaucomatous visual field loss that were detected by the Visual Fields Easy app (George Kong Software, available for free on iTunes) along with a corresponding gray scale representation from a Humphrey Field Analyzer (Carl Zeiss Meditec) 24-2 SITA Standard examination. Testing with the Visual Fields Easy app can be completed in less than 3.5 minutes per eye, and preliminary results indicate good screening performance.6 Additional procedures for other tablets with fewer test locations and shorter testing times are currently under development and evaluation. Screening with the Visual Fields Easy app and other similar apps could be a valuable option in underdeveloped countries, for individuals with limited access to traditional health care facilities, and for preliminary testing in waiting rooms before patients' examinations.
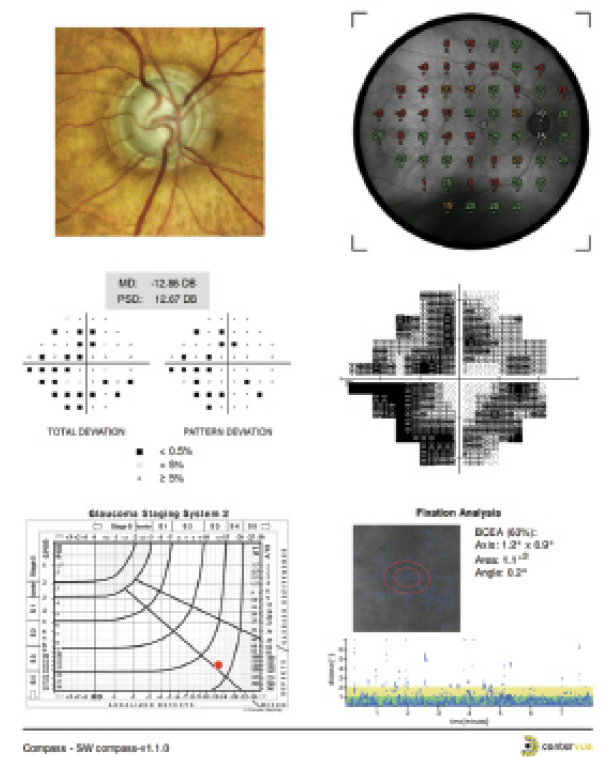
Figure 2. An example of the printout from the Compass microperimeter for the right eye of a patient with moderate glaucomatous visual field loss. The top panel (not shown) contains the patient's name, date and time of testing, the type of test, and blind spot fixation accuracy and false-positive rate. The next lower panel presents a full-color image of the optic disc from scanning laser ophthalmoscopy on the left, with a superimposition of the threshold sensitivity perimetry values on the optic disc image on the right. Below this is the grayscale representation of the 24-2 visual field (right) and the total and pattern deviation plots on the left, along with mean deviation and pattern standard deviation values. The bottom panel presents the results plotted on the Brusini glaucoma staging system on the left and the fixation behavior of the patient during the test on the right.
VISUAL FIELD ANALYSIS PROCEDURES
Until recently, perimetry used traditional statistical and mathematical analysis procedures for detection and progression assessments. New methods are being developed to evaluate medical procedures in various medical fields. A common challenge encountered in many fields of study is distinguishing a specific marker (signal) from variable results (noise).7 Techniques that can better extract signal from noise should produce a meaningful improvement in the capabilities of this diagnostic tool for visual field analysis and interpretation.
MICROPERIMETRY
Recent studies have indicated that implementing a variety of new techniques in OCT can provide stronger structure-function associations.8 These associations may be further improved by measuring the full visual field and by developing alignment (eye and head tracking) procedures for microperimetry that are similar to the procedures used for OCT. Until recently, microperimetry has been restricted to the macular region and has been mostly used by retinal specialists. The Compass microperimeter (CenterVue) has been designed to evaluate the central 30º radius for glaucoma. Efforts to refine microperimetry for evaluating glaucomatous visual fields should permit a better functional assessment. Figure 2 presents an example of microperimetry using the Compass device and a Humphrey visual field 24-2 test pattern.
Current methods of measuring structure and function are conducted at different time periods and compared later. Obtaining these measurements at the same time should better explain the relationship between structure and function as well as improve the alignment, registration, and localization of features.
CONCLUSION
The development, evaluation, and validation of new visual field procedures for characterizing and monitoring glaucomatous damage will require considerable time, multicenter trials, evidence-based decisions, and clinical meaningfulness. These goals must be accomplished using state-of-the-art methods and technology yet be simple and clear so that they can be effectively pursued in a busy clinical setting. Clinical investigators have an opportunity to enhance the utility of perimetry and visual field testing as diagnostic tools. n

Chris A. Johnson, PhD, DSc, is a professor in the Department of Ophthalmology and Visual Sciences at the University of Iowa Hospitals and Clinics in Iowa City, Iowa. He is a consultant to CenterVue. Dr. Johnson may be reached at (319) 356-0384; chris-a-johnson@uiowa.edu.
1. Bengtsson B, Heijl A. Evaluation of a new perimetric strategy, SITA, in patients with manifest and suspect glaucoma. Acta Ophthalmol Scand. 1998;76:368-375.
2. Turpin A, McKendrick AM, Johnson CA, Vingrys AJ. Properties of perimetric threshold estimates from full threshold, ZEST and SITAlike strategies as determined by computer simulation. Invest Ophthalmol Vis Sci. 2003;44:4787-4795.
3. Ehrlich AC, Raza AS, Ritch R, Hood DC. Modifying the conventional visual field test pattern to improve the detection of early glaucomatous defects in the central 10°. Transl Vis Sci Technol. 2014;3(6):6.
4. Hood DC, Nguyen M, Ehrlich AC, et al. A test of a model of glaucomatous damage of the macula with high-density perimetry: implications for the locations of visual field test points. Transl Vis Sci Technol. 2014;3(3):5.
5. Sun H, Dul MW, Swanson WH. Linearity can account for the similarity among conventional, frequency-doubling, and gabor-based perimetric tests in the glaucomatous macula. Optom Vis Sci. 2006,83:455-465.
6. Johnson CA, Thapa S, Robin AL. Spatial distribution of visual field loss for diabetic retinopathy and glaucoma using an iPad Visual Field Screening Test. Paper presented at: The Association for Research in Vision and Ophthalmology Annual Meeting; May 5, 2015; Denver, CO.
7. Artes PH, Chauhan BC. Signal/noise analysis to compare tests for measuring visual field loss and its progression. Invest Ophthalmol Vis Sci. 2009;10:4700-4708.
8. Bogunovic H, Kwon YH, Rashid A, et al. Relationships of retinal structure and Humphrey 24-2 visual field thresholds in patients with glaucoma. Invest Ophthalmol Vis Sci. 2014;56:259-271.