Glaucoma is a characteristic optic neuropathy with a corresponding loss of visual function. In the careful evaluation of the structure-function relationship, the astute clinician is able to differentiate true glaucomatous damage and progression from testing artifact. Optical coherence tomography (OCT) arguably revolutionized the detection of glaucoma and its progression. The current standard for this technology is spectral domain OCT (SD-OCT), although the arrival of swept-source OCT is generating excitement in the field. Standard automated perimetry (SAP) remains the gold standard for functional assessment in glaucoma.
COMBINING STRUCTURE AND FUNCTION
The relative contribution of structural and functional assessments may depend on disease stage. Marvasti et al found consistency in the amount of retinal nerve fiber loss corresponding to the changing degree of visual field mean deviation until glaucoma became advanced, at which point little additional retinal nerve fiber layer was lost.1 With current technology, structural changes are more easily detectable in early disease, whereas functional assessments are more likely to show change in eyes with advanced disease. This likely explains the limited agreement between optic disc and visual field progression in the Ocular Hypertension Treatment Study (OHTS), where structural progression was more prevalent. Kuang and colleagues recently found that, in 35% of cases, OCT was able to demonstrate damage up to 4 years before SAP showed changes.2 To monitor progression across the spectrum of glaucoma severity, it would be advantageous to combine structure and function into a single, continuous variable.
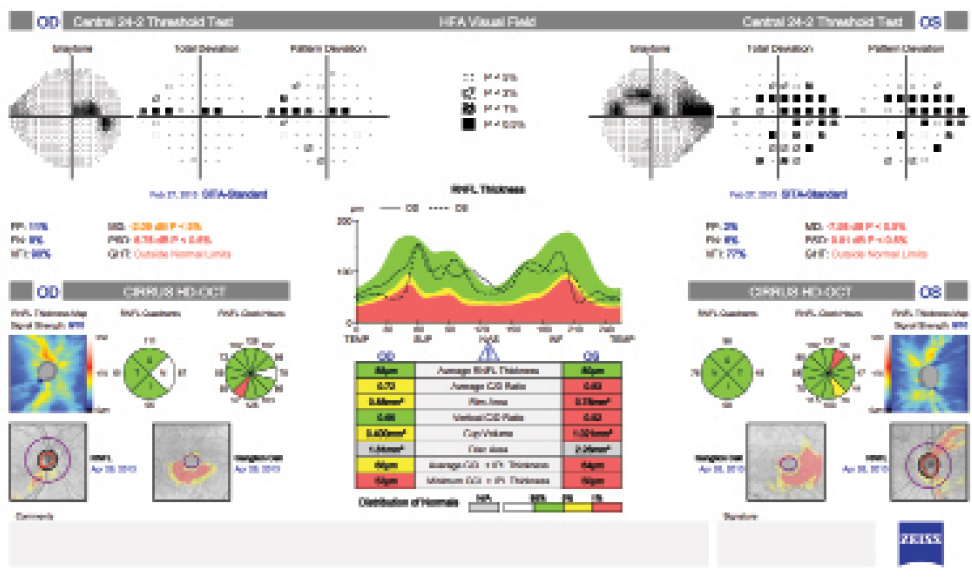
Figure. A combined structure and function report, created with the Humphrey Field Analyzer-Cirrus Combined Report (Carl Zeiss Meditec), integrates information from the visual field and OCT scan of the optic nerve head and macula. The presentation of data on the optic nerve and visual function in a single view allows for the rapid comparison and integration of the structure and function of the optic nerve.
The combined structure-function index is the estimated proportion of lost retinal ganglion cells (RGCs) compared to the amount in an age-matched healthy eye. The estimations of RGC counts are created from measurements of SAP sensitivities and SD-OCT measurements. Medeiros has shown that RGC estimates are lower in eyes developing glaucoma than eyes that are not. More importantly, he reported that the RGC estimates (or the combined structure-function index) outperformed SD-OCT in terms of detecting eyes that eventually converted to glaucoma (area under receiver-operating characteristic, 0.95 vs 0.88; P = .001).3 RGC estimates perform even better when compared to traditional markers of glaucoma such as cup-to-disc ratio (CDR). Tatham and colleagues demonstrated that, although SD-OCT estimates of CDR agreed well with photographic assessments (r = 0.83), the CDR was not closely associated with the RGC estimate in eyes with large disc areas. These findings suggest that CDR is not a sensitive method of estimating glaucomatous progression.4
THE MACULA
The importance of looking for glaucoma in the region responsible for central vision is becoming increasingly well recognized. Because the standard 24-2 SAP testing strategy samples the macular area sparsely (every 6º) and can easily miss central visual defects, specific testing aimed at the macula (eg, the 10-2 strategy) may be warranted.
The macula occupies less than one-twentieth of the retinal surface area but contains almost one-third of the RGCs. Even early in the disease process, glaucoma can damage the macula.5 In moderate glaucoma, up to one-half of eyes may have glaucomatous damage within the central 3º of fixation.6
Within the macula, RGC counts may also be estimated using macular ganglion cell-inner plexiform layer thickness measurements and perimetry results from within the central 10º of the visual field. Again, these estimates can outperform SD-OCT macular ganglion cell-inner plexiform layer thickness measurements in the detection of glaucoma (area under receiver-operating characteristic, 0.87 vs 0.78; P = .015).7
CONCLUSION
The literature suggests that using a combination of structural and functional analyses enhances physicians' ability to detect glaucoma and its progression. At present, the majority of data combining structure and function exists in the research realm (the University of California, San Diego, in particular). It seems logical to think, however, that the evolution of imaging systems and medical informatics will eventually allow practitioners to routinely use combined structural and functional data at the level of individual patients to enhance glaucoma care (Figure). n

Nathan M. Radcliffe, MD, is the director of the Glaucoma Service at NYU Langone Ophthalmology Associates in New York. He acknowledged no financial interest in the products or company mentioned herein. Dr. Radcliffe may be reached at (212) 263-2573; fax: (212) 263-2574; drradcliffe@gmail.com.
1. Marvasti AH1, Tatham AJ, Zangwill LM, et al. The relationship between visual field index and estimated number of retinal ganglion cells in glaucoma. PLoS One. 2013;8(10):e76590.
2. Kuang TM, Zhang C, Zangwill LM, et al. Estimating the lead time gained by optical coherence tomography in detecting glaucoma before development of visual field defects. Ophthalmology. [published online ahead of print July 18, 2015]. doi:10.1016/j.ophtha.2015.06.015.
3. Medeiros FA, Lisboa R, Weinreb RN, et al. Retinal ganglion cell count estimates associated with early development of visual field defects in glaucoma. Ophthalmology. 2013;120(4):736-44.
4. Tatham AJ, Weinreb RN, Zangwill LM, et al. The relationship between cup-to-disc ratio and estimated number of retinal ganglion cells. Invest Ophthalmol Vis Sci. 2013;54(5):3205-3214.
5. Hood DC, Raza AS, de Moraes CG, et al. Glaucomatous damage of the macula. Prog Retin Eye Res. 2013;32:1-21.
6. Schiefer U, Papageorgiou E, Sample PA, et al. Spatial pattern of glaucomatous visual field loss obtained with regionally condensed stimulus arrangements. Invest Ophthalmol Vis Sci. 2010;51:5685-5689.
7. Zhang C, Tatham AJ, Weinreb RN, et al. Relationship between ganglion cell layer thickness and estimated retinal ganglion cell counts in the glaucomatous macula. Ophthalmology. 2014;121(12):2371-2379.