AT A GLANCE
- Glaucoma is theorized to have a vascular component and is associated with reduced ocular blood flow.
- Current imaging modalities visualizing ocular perfusion primarily provide static/structural measurements.
- A recent study utilized a laser speckle contrast imaging device, the XyCAM RI, to measure dynamic blood flow and found significant differences between glaucoma patients, glaucoma suspects, and healthy individuals.
- The XyCAM RI may allow the identification of dynamic vascular biomarkers, which could facilitate earlier disease diagnosis.
Given that up to one-third of patients with glaucoma have “normal” IOPs and that the disease can progress even when the IOP measures within the target range, it is clear that alternative biomarkers and treatment targets are needed.1 For more than a century, clinicians and scientists have theorized that there is a vascular component to glaucoma, and a substantial body of work supports an association between poor ocular perfusion and glaucoma.2 Large epidemiologic studies such as the Baltimore Eye Disease Survey and the Barbados Eye Study have shown up to a sixfold higher risk of glaucoma in individuals with low systemic blood pressure.1,3 Further, an association between glaucoma and reduced ocular blood flow has been shown using various methods, including direct observation of vessel caliber with fluorescein angiography4,5 and technologies such as laser doppler imaging,6 laser speckle imaging,7,8 and, more recently, OCT angiography.9,10
Imaging modalities that are commonly available in the office, including fluorescein angiography, indocyanine green angiography, and OCT angiography, are best suited to provide structural measurements such as perfused vessel density and vessel caliber, which have been shown to be reduced in glaucoma.11 However, these modalities do not measure dynamic blood flow.
In a recent study, we used real-time measurements of blood flow in the optic nerve head (ONH) to distinguish between glaucomatous eyes and controls.8 This was accomplished with an FDA-cleared, high-speed, portable ocular blood flow imaging device, the XyCAM RI (Vasoptic Medical), which uses laser speckle contrast imaging (LSCI) to measure dynamic changes in ocular blood flow (Figure 1). LSCI is a noninvasive technique that utilizes a low-intensity, nonscanning laser to illuminate the posterior segment; this leads to speckle formation in the acquired image data that can subsequently be processed to estimate ocular blood flow information. A distinct advantage of LSCI is its ability to assess temporal dynamics of the retinal vasculature, which may reveal changes in ocular pathologies associated with blood flow pulsations and alterations.12,13

Figure 1. Images of ocular blood flow obtained using the XyCAM RI. Blood flow velocity images centered around the ONH and the macula for control eyes (A, B) and glaucomatous eyes (C, D). The same colormap scale is used across the subjects to display low flow velocities in cooler colors and high flow velocities in hotter colors. Abbreviation: a.u., arbitrary unit. Reprinted with permission from Vinnett et al.8
BLOOD FLOW VELOCITY INDEX METRICS
In our study, the XyCAM RI was used to assess temporal characteristics of dynamic foveal and ONH blood flow patterns in 20 healthy individuals who served as controls, 16 glaucoma suspects, and 10 patients with glaucoma.8 The aims of the study were to determine the repeatability of dynamic blood flow measurements and to characterize the ability of XyCAM RI blood flow metrics to differentiate patients with glaucoma and glaucoma suspects from healthy controls. Ten unique blood flow metrics were used to characterize dynamic blood flow for each region of interest: disc vessels, disc perfusion (with major retinal vessels masked), and the fovea (Figure 2).
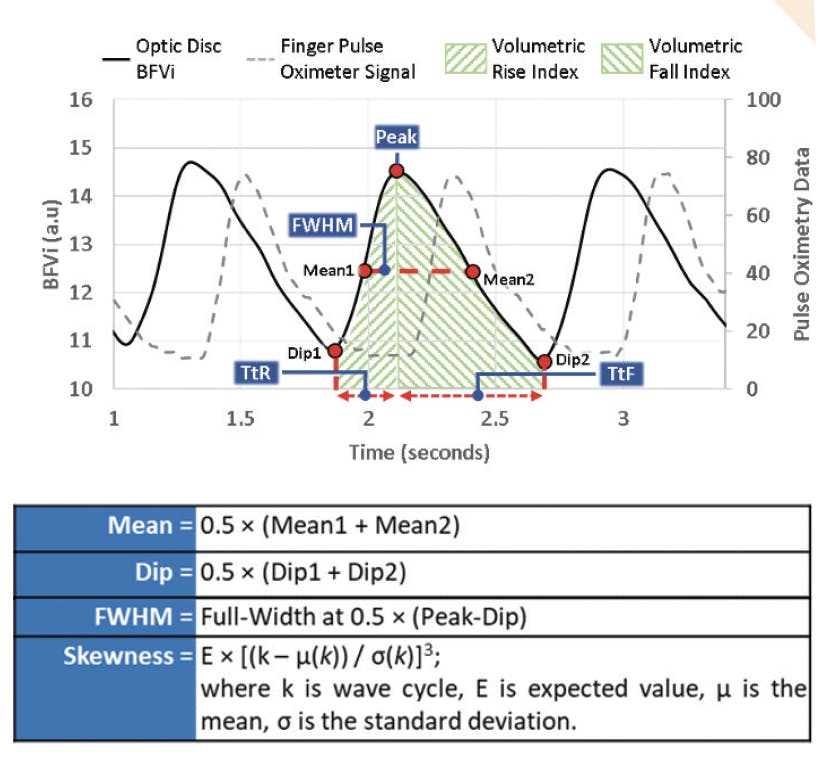
Figure 2. Illustration of a pulsatile blood flow velocity index (BFVi) waveform and computation of ocular blood flow metrics. Dip BFVi and peak BFVi pertain to phases corresponding to the cardiac diastole and systole. Mean BFVi corresponds to the average of the means of the rising and falling phases. Abbreviations: FWHM, full width half maximum; TtF, time-to-fall; TtR, time-to-rise; VFI, volumetric fall index (area under the falling portion of the BFVi waveform); VRI, volumetric rise index (area under the rising portion of the BFVi waveform). Reprinted with permission from Vinnett et al.8
Patients with glaucoma were found to have both decreased blood flow and greater blood flow variation than controls. Furthermore, measurements obtained from blood vessels in the ONH could be used to differentiate glaucoma patients from glaucoma suspects: On average, blood flow velocity metrics in glaucoma suspects were greater than in glaucoma patients but lower than in controls. Blood flow velocity metrics were also correlated with established risk factors and features of glaucoma, including age, cup-to-disc ratio, minimum rim width, overall retinal nerve fiber layer thickness, mean deviation, and pattern standard deviation.
The breadth of metrics available with the assessment of ocular blood flow dynamics using the XyCAM RI presents new avenues that may allow earlier glaucoma diagnosis and the identification of individuals with the highest risk of developing the disease. Further research is required to assess the role of real-time ocular blood flow dynamics in glaucoma management and to determine whether the XyCAM RI can provide diagnostic classification with a high degree of confidence in larger clinical trials.
CONCLUSION
This study represents the first assessment of a new LSCI-based ocular imaging device, the XyCAM RI, in patients with glaucoma. Notably, this work is also the first LSCI-based study to enroll a multiethnic population, including a large proportion of African American individuals.
Dynamic blood flow metrics measured with the XyCAM RI were reliable, were associated with structural and functional glaucoma metrics, and were significantly different among controls, glaucoma suspects, and glaucoma patients. The device may facilitate disease diagnosis in populations where it can be challenging, such as individuals with high myopia whose retinal nerve fiber layer can be thin. Additionally, the identification of differences in blood flow between glaucoma patients and glaucoma suspects may help to distinguish early phases of the disease. Further testing of these applications is warranted.
Crucial next steps include continuing to assess the role of dynamic ocular blood flow in glaucoma management and further elucidating the pathways and mechanisms involved in glaucoma pathogenesis reflected by dynamic blood flow biomarkers. Larger clinical trials are needed to evaluate the efficacy of XyCAM RI in glaucoma diagnostics and disease severity classification, particularly in cases in which interpretation of conventional diagnostic methods is challenging.
Author's note: The study discussed in this article was supported, in part, by a grant from the Maryland Industrial Partnerships program, a portion of which came from Vasoptic Medical.
1. Sommer A, Tielsch JM, Katz J, et al. Relationship between intraocular pressure and primary open angle glaucoma among White and Black Americans: The Baltimore Eye Survey. Arch Ophthalmol. 1991;109(8):1090-1095.
2. Smith P. Glaucoma: Its Causes, Symptoms, Pathology and Treatment. J.A. Churchill; 1879.
3. Leske MC, Connell AM, Schachat AP, Hyman L. The Barbados Eye Study. Prevalence of open angle glaucoma. Arch Ophthalmol. 1994;112(6):821-829.
4. Spaeth GL. Fluorescein angiography: its contributions towards understanding the mechanisms of visual loss in glaucoma. Trans Am Ophthalmol Soc. 1975;73:491-553.
5. Talusan ED, Schwartz B, Wilcox LM. Fluorescein angiography of the optic disc: a longitudinal follow-up study. Arch Ophthalmol. 1980;98(9):1579-1587.
6. Holló G, van den Berg TJ, Greve EL. Scanning laser Doppler flowmetry in glaucoma. Int Ophthalmol. 1996;20(1-3):63-70.
7. Srienc AI, Kurth-Nelson ZL, Newman EA. Imaging retinal blood flow with laser speckle flowmetry. Front Neuroenergetics. 2010;2:128.
8. Vinnett A, Kandukuri J, Le C, et al. Dynamic alterations in blood flow in glaucoma measured with laser speckle contrast imaging. Ophthalmol Glaucoma. 2021;0(0).
9. Van Melkebeke L, Barbosa-Breda J, Huygens M, Stalmans I. Optical coherence tomography angiography in glaucoma: a review. Ophthalmic Res. 2018;60(3):139-151.
10. Jones A, Kaplowitz K, Saeedi O. Autoregulation of optic nerve head blood flow and its role in open-angle glaucoma. Expert Rev Ophthalmol. 2014;9(6):487-501.
11. Yarmohammadi A, Zangwill LM, Diniz-Filho A, et al. Optical coherence tomography angiography vessel density in healthy, glaucoma suspect, and glaucoma eyes. Invest Ophthalmol Vis Sci. 2016;57(9):OCT451-OCT459.
12. Rege A, Cunningham SI, Liu Y, et al. Noninvasive assessment of retinal blood flow using a novel handheld laser speckle contrast imager. Transl Vis Sci Technol. 2018;7(6):7.
13. Cho KA, Rege A, Jing Y, et al. Portable, non-invasive video imaging of retinal blood flow dynamics. Sci Rep. 2020;10(1):1-1.


